Want to improve your customer journey and boost business results? Start by tracking these 15 key metrics.
From acquisition to advocacy, these metrics help you measure and optimize every stage of the customer journey. Here's a quick overview:
- Acquisition Metrics: CAC (Cost to Acquire Customers), Time to First Use, First Touch Attribution
- Engagement Metrics: CES (Customer Effort Score), Pages per Visit, Cross-Channel Usage
- Conversion Metrics: Conversion Rate, Average Order Value (AOV), Cart Abandonment Rate
- Retention Metrics: Customer Lifetime Value (CLV), Customer Loss Rate, Repeat Purchase Rate
- Advocacy Metrics: Net Promoter Score (NPS), Referral Success Rate, Social Share Rate
Each metric provides actionable insights to reduce churn, increase ROI, and improve customer satisfaction. For example, reducing Time to First Use can boost activation rates by up to 60%, while improving CES can lead to a 17% increase in customer spending.
Quick Comparison:
| Metric | Stage | Purpose |
|---|---|---|
| CAC | Acquisition | Measure cost-efficiency of acquiring customers |
| Time to First Use | Acquisition | Track time from signup to first interaction |
| Conversion Rate | Conversion | Measure how many prospects take action |
| Customer Lifetime Value | Retention | Assess long-term customer profitability |
| Net Promoter Score | Advocacy | Gauge customer loyalty and advocacy |
Ready to optimize your customer journey? Let’s dive into the details.
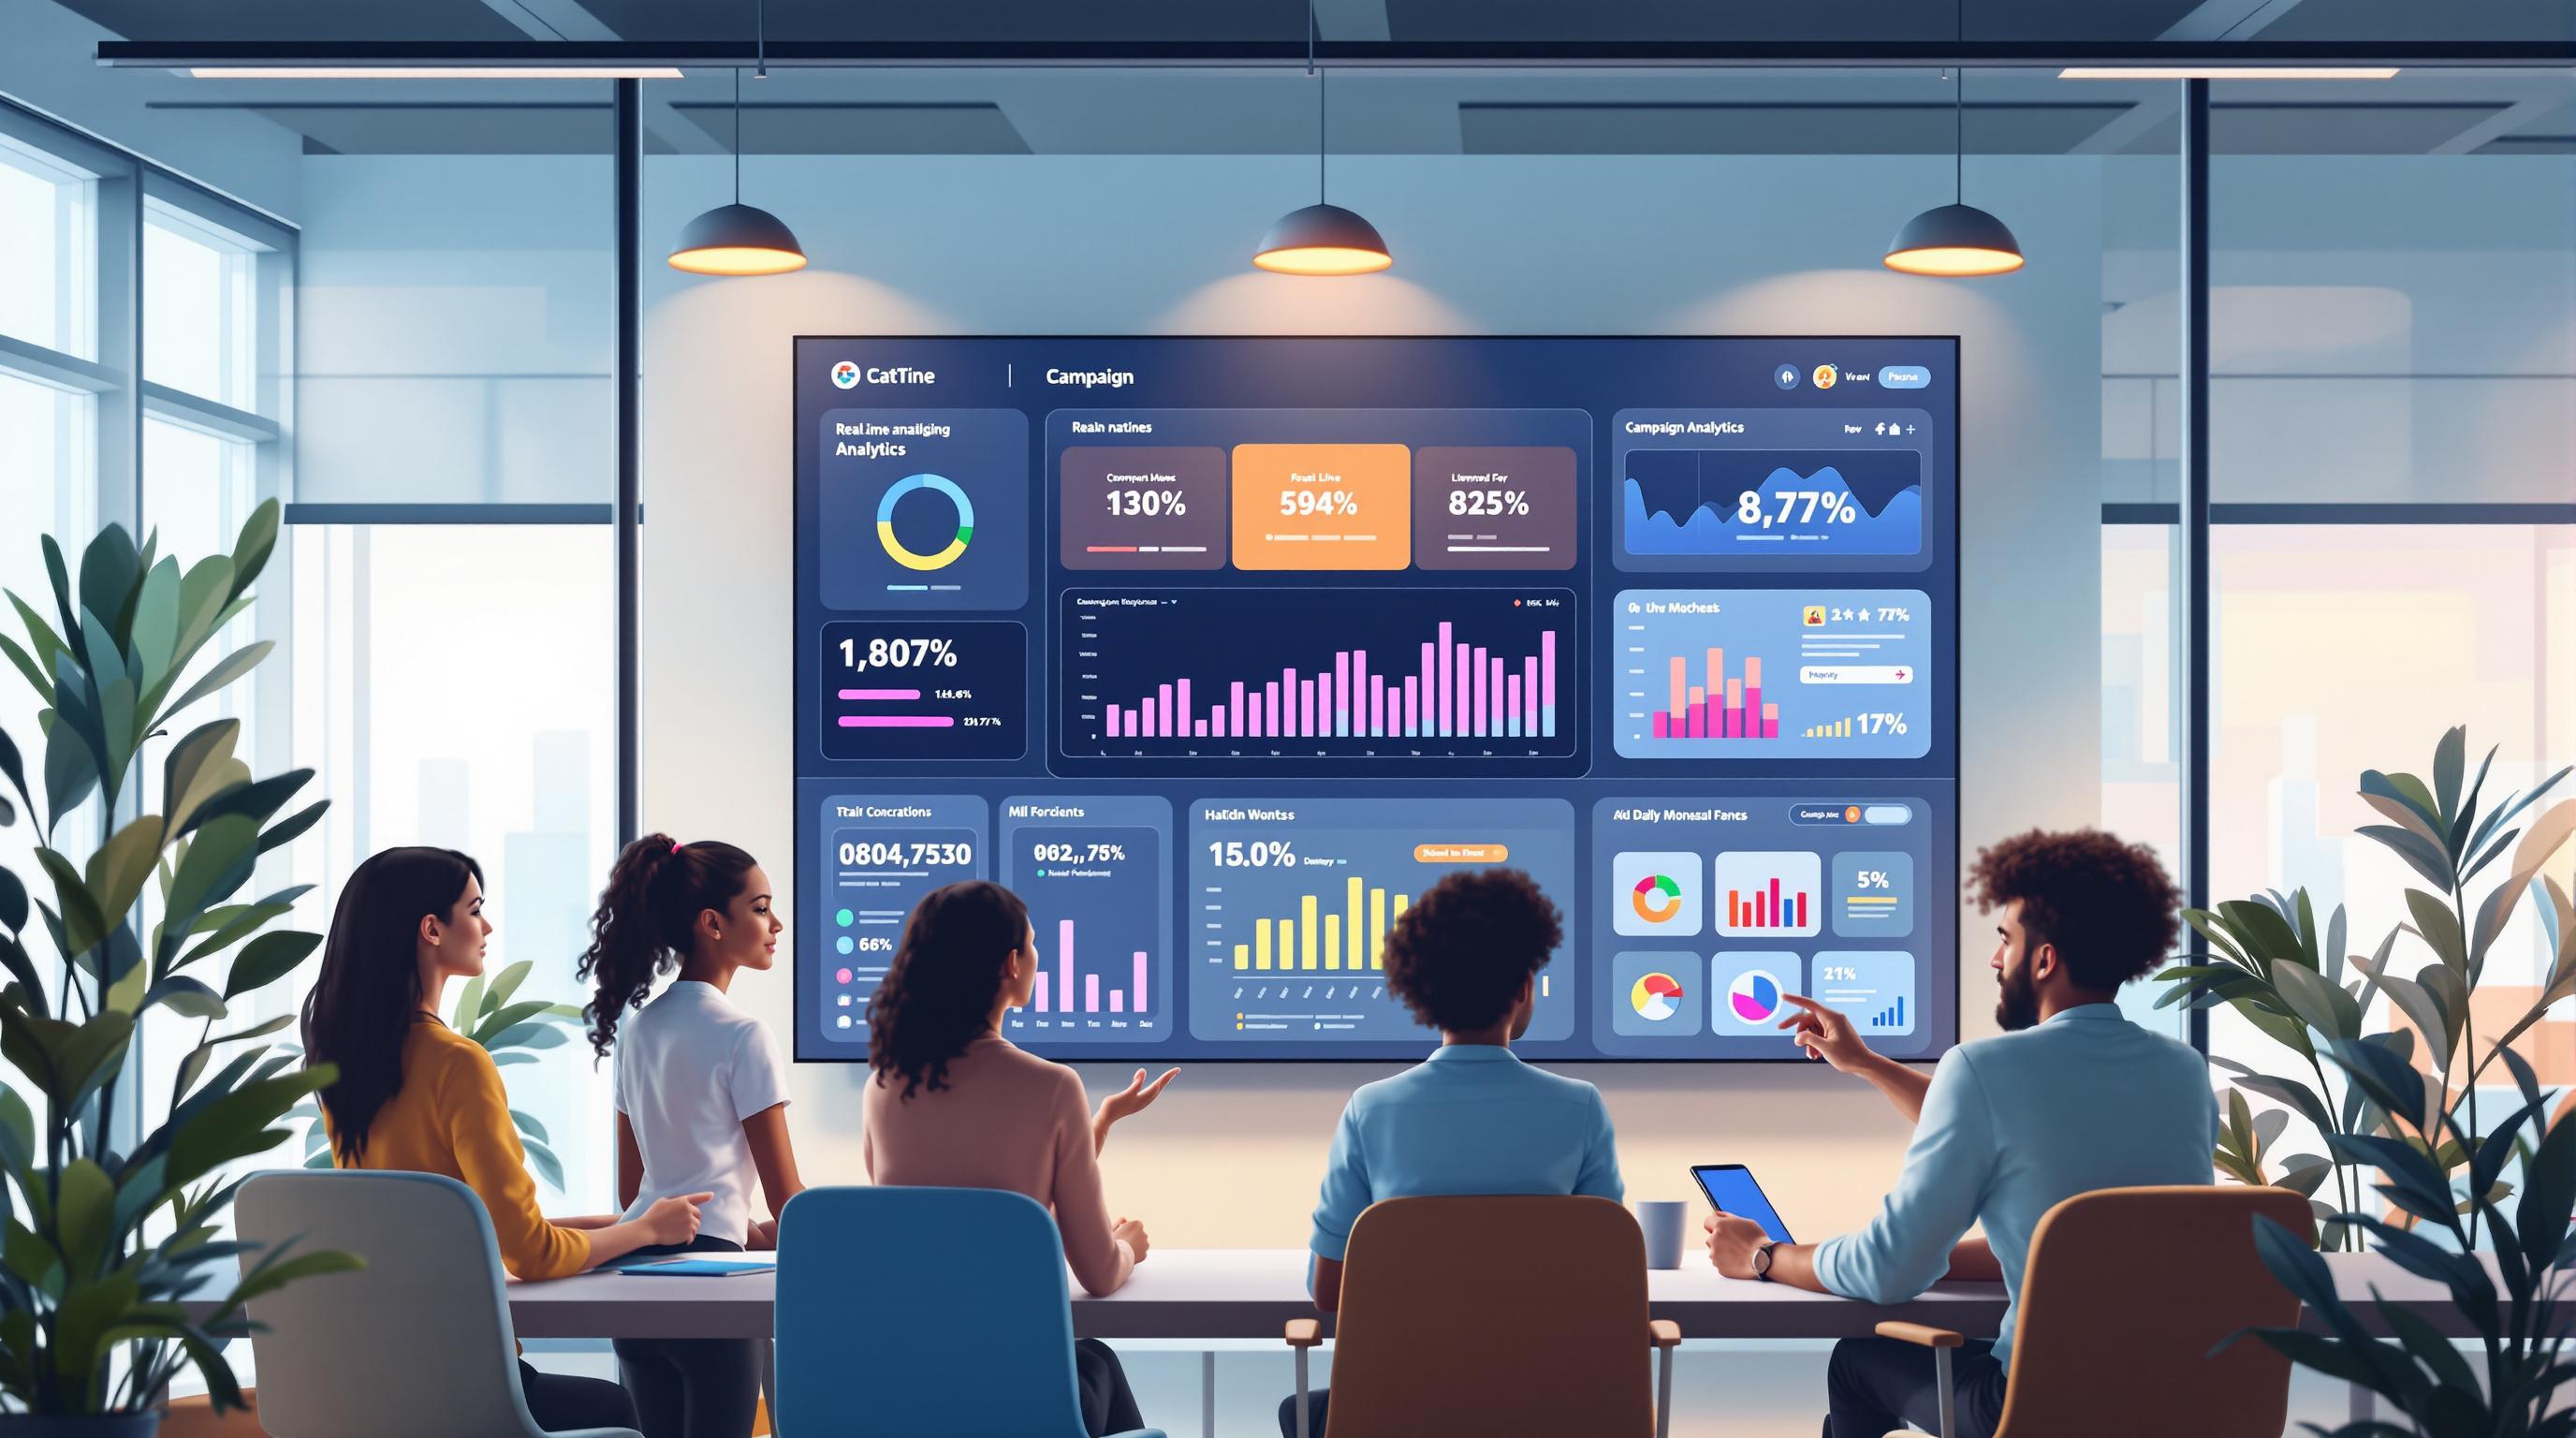
Customer Journey Analytics in under 5 minutes
Customer Journey Stages
These stages correspond to 15 key metrics, helping you fine-tune efforts at every step.
Acquisition metrics like CAC (Customer Acquisition Cost) and Time to First Use assess how effectively you’re reaching new customers. Engagement metrics - such as CES (Customer Effort Score) and Cross-Channel Usage - show how well customers are interacting with your brand. Conversion metrics measure how many prospects complete purchases, while Retention metrics focus on customer loyalty and repeat business. Lastly, Advocacy metrics evaluate how willing customers are to recommend your brand.
- Acquisition: This phase is all about drawing in potential customers. Metrics like CAC, Time to First Use, and First Touch Attribution help gauge your success here.
- Engagement: At this stage, customers are actively exploring your brand and its offerings.
- Conversion: This is the turning point where prospects become paying customers. Key metrics include Conversion Rate, Average Order Value (AOV), and Cart Abandonment Rate.
- Retention: This stage focuses on maintaining long-term relationships and minimizing churn. Metrics like Customer Lifetime Value (CLV), Customer Loss Rate, and Repeat Purchase Rate are essential.
- Advocacy: Loyal customers become brand ambassadors here. Metrics like Net Promoter Score (NPS), Referral Success Rate, and Social Share Rate help measure their impact.
Each stage and metric provides valuable insight into the customer journey, making it easier to optimize your strategies.
1. Time to First Use
Time to First Use (TTFU) is a key metric in the acquisition stage, measuring the time between a user signing up and completing their first meaningful interaction with your product or service. It’s a crucial factor in shaping the customer experience from the very start.
Companies that manage to reduce TTFU often see 60% higher activation rates and 15-20% increases in Customer Lifetime Value (CLV) [7][9]. This metric doesn’t just stop at the acquisition phase - it influences every stage of the customer journey.
Take Dropbox, for example. By cutting TTFU from 3.5 minutes to just 43 seconds through a more efficient onboarding process, they saw a 26% boost in first-week activation and a 14% drop in support tickets.
Here’s how TTFU varies across industries:
| Industry | Target TTFU |
|---|---|
| Social Media Apps | Seconds to minutes |
| E-commerce | Minutes to hours |
| B2B Software | Hours to days |
| Enterprise Solutions | Days to weeks |
Tips to Improve TTFU
- Simplify onboarding: Use visual progress indicators and minimize unnecessary steps.
- Offer clear guidance: Incorporate interactive tutorials that highlight essential features.
- Personalize the process: Tailor the experience to align with individual user needs.
"A shorter Time to First Use often correlates with higher customer satisfaction and lower churn rates. It's one of the most reliable predictors of long-term user engagement." [6]
2. Cost to Acquire Customers
Over the last five years, the Cost to Acquire Customers (CAC) has increased by almost 50% across industries [9]. This metric plays a key role in assessing how efficiently resources are used during the initial phase of the customer journey. Since it represents the first measurable investment in acquiring customers, CAC directly influences profitability throughout the entire customer lifecycle.
Here's the formula to calculate CAC:
CAC = (Total Sales and Marketing Expenses) / (Number of New Customers Acquired)
CAC benchmarks differ widely depending on the industry and target audience. Below is a snapshot of average CAC figures across various sectors:
| Industry | Average CAC |
|---|---|
| SaaS | $205 - $700 |
| E-commerce | $10 - $200 |
| Financial Services | $200 - $1,500 |
| Healthcare | $100 - $1,000 |
| *Industry standard CLV:CAC ratio is 3:1 |
For example, a fintech startup achieved a 31% reduction in CAC by leveraging predictive lead scoring. This approach boosted conversion rates by 18%, all while maintaining lead quality.
Key Factors That Drive CAC
Several factors contribute to CAC, including:
- Advertising expenses
- Sales team salaries and commissions
- Marketing technology tools
- Costs of producing content
- Spending on event marketing
How to Optimize CAC
To manage and reduce CAC effectively, consider these strategies:
- Automate marketing workflows to save time and resources.
- Improve targeting accuracy by focusing on high-quality leads.
- Refine conversion processes to reduce friction and boost success rates.
Top-performing businesses aim for a healthy CLV:CAC ratio, typically spending $1 to generate $3 in customer lifetime value [5].
Using tools like the Marketing Analytics Tools Directory can provide a detailed view of CAC by channel and customer type. This insight helps pinpoint which acquisition strategies offer the best returns on investment.
3. First Touch Attribution
First Touch Attribution focuses on identifying the channels that spark initial engagement with your brand. Unlike CAC, which looks at overall acquisition costs, this metric assigns 100% of the credit for a conversion to the very first interaction a customer has with your business. It's a powerful way to understand which marketing efforts are drawing people in. In fact, 38% of marketers now use this method as part of their broader attribution strategies, highlighting its role in understanding the customer journey[9].
Why First Touch Matters
For businesses with long sales cycles, identifying the channels that qualify prospects is key. First Touch Attribution can pinpoint those initial touchpoints that attract the right audience. For example, enterprise software companies using this strategy saw a 23% boost in marketing ROI by fine-tuning their early-stage interactions[7]. This isn’t about just driving traffic - it’s about finding where your most valuable leads come from.
How to Track It Right
To get accurate data on First Touch Attribution, you’ll need to:
- Use UTM parameters or tracking pixels across your marketing channels.
- Set clear conversion goals to measure success.
- Track the entire journey from the first interaction to the final conversion.
B2B businesses, in particular, benefit from this approach because it helps them understand which channels spark meaningful relationships with potential clients[1]. It also works hand-in-hand with optimizing CAC by highlighting the most effective acquisition sources.
Tips for Better Attribution
Want to make the most of First Touch Attribution? Here are some ways to improve your tracking:
- Extend cookie durations and link offline and online interactions using unique IDs.
- Use cross-device tracking to follow users across multiple platforms.
- Regularly validate your data to ensure it’s accurate and reliable.
4. Customer Effort Score
Customer Effort Score (CES) measures how easy or difficult it is for customers to resolve issues with your business. It’s a key metric during the engagement stage, directly influencing retention and conversion rates. As customers transition from acquisition to engagement, CES plays a vital role in keeping them on track.
How CES Is Measured
CES typically relies on a 7-point scale where customers evaluate statements like: "The company made it easy to resolve my issue."
| CES Score Range | Experience Level | Typical Customer Response |
|---|---|---|
| 6-7 | Low Effort | Likely to repurchase and recommend |
| 4-5 | Moderate Effort | May consider alternatives |
| 1-3 | High Effort | High risk of leaving |
Why CES Matters for Customer Behavior
There’s a clear link between customer effort and loyalty. Studies reveal that reducing effort can lead to major benefits:
- A one-point improvement in CES can result in a 17% increase in customer spending [9].
- Businesses that focus on reducing effort see a 10-20% rise in satisfaction scores [7].
For example, T-Mobile revamped its service model, cutting calls per account by 56%, reducing churn by 31%, and boosting its NPS by 60%.
How to Lower Customer Effort
Reducing effort is all about simplifying the customer experience. Focus on these areas:
- Streamline Self-Service: Use well-designed knowledge bases and AI chatbots.
- Empower Support Teams: Allow agents to resolve issues without escalating them.
- Proactive Solutions: Address common problems before customers encounter them.
- Eliminate Redundancies: Simplify workflows to save customers time and hassle.
Tracking CES Across Key Interactions
To get accurate CES data, gather feedback right after important touchpoints like onboarding or support interactions. Low CES scores often align with behaviors like fewer Pages per Visit (our next metric), as frustrated customers tend to disengage.
5. Pages per Visit
Pages per Visit measures how deeply users explore your content during a single session, offering a clear picture of engagement levels.
Industry Benchmarks
Engagement levels vary by industry, influenced by user behavior:
| Industry | Average Pages/Visit | Insights |
|---|---|---|
| E-commerce | 3.4 | Indicates active product browsing[11] |
| B2B Websites | 2.3 | Users focus on specific solutions[11] |
| Media/Publishing | 2.9 | Reflects interest in content exploration[11] |
This metric aligns closely with the Engagement stage in the Customer Journey Stages framework.
Impact on Customer Journey Success
For example, REI boosted their Pages per Visit from 3.2 to 4.7 by introducing personalized recommendations, which resulted in a 23% increase in conversions.
Device-Specific Patterns
Device preferences play a big role in how this metric performs:
- Mobile: Sessions typically include 30% fewer pages compared to desktop. To address this, focus on:
- Simplified Navigation: Make menus easy to use, even with one hand.
- Content Layout: Present information in clear, scannable formats.
- Page Load Speed: Ensure pages load quickly to avoid losing users.
Warning Signs and Opportunities
A low Pages per Visit score could point to issues like:
- Poor internal linking or confusing navigation
- Irrelevant content or weak search functionality
Optimization Strategies
To improve this metric, consider these steps:
- Strengthen internal linking and provide behavior-based content recommendations.
- Streamline search functions and simplify menu navigation.
For a fuller understanding, analyze Pages per Visit alongside bounce rate and time-on-page for a more complete engagement picture.
6. Cross-Channel Usage
Pages per Visit gives you a snapshot of engagement during a single session, but Cross-Channel Usage goes deeper. It looks at how customers move between platforms, which plays a big role in keeping their journey smooth and connected.
Key Performance Indicators
- Channel Adoption Rate: 73% of customers interact with multiple channels [1].
- Cross-Channel Conversion: Often outperforms single-channel conversion rates.
- Channel Switching Frequency: Highlights the complexity of the customer journey.
Real-World Impact
Starbucks offers a great example of cross-channel success. Their mobile-to-store integration boosted mobile order sales by 20% and cut store wait times by 15%. This shows how a well-connected strategy can support key parts of the customer journey, especially when it comes to engagement and conversion.
Channel Types
| Channel Type | Success Indicators |
|---|---|
| Website | Depth of engagement |
| Mobile App | Retention of users |
| Social Media | Growth in community size |
| Effectiveness of campaigns |
Optimization Strategies
Businesses with effective cross-channel strategies keep 89% of their customers, compared to just 33% for those with weaker approaches [6]. To improve, focus on:
- Data Integration: Use a unified platform to manage customer data.
- Consistent Experience: Ensure branding and messaging stay cohesive across all platforms.
- Seamless Transitions: Make switching between channels effortless for users.
Specialized tools (check out the Marketing Analytics Tools Directory) are available to help unify and analyze cross-channel data.
"90% of customers expect consistent interactions across channels" [7]
7. Conversion Rate
Conversion rate is all about measuring how well prospects move from considering your offer to taking action. While the average conversion rate hovers around 2.35%, top performers hit rates of 5.31% or higher [6].
Unlike Cross-Channel Usage (Metric 6), which looks at how customers interact across platforms, this metric focuses on whether those interactions result in actions that matter - like purchases, sign-ups, or inquiries.
Industry Performance
Conversion rates can vary a lot depending on the industry. Here's a quick look at how different sectors stack up:
| Industry | Average Conversion Rate |
|---|---|
| Finance | 5.1% |
| B2B | 3.2% |
| Healthcare | 3.6% |
| E-commerce | 2.63% |
| Travel | 2.4% |
Source: WordStream Industry Benchmarks (2023) [3]
Device Impact
The device your audience uses can make a big difference. Desktop users convert at a much higher rate (3.91%) compared to mobile users (1.81%) [9]. This highlights the need for tailored strategies depending on whether your audience is on a desktop or mobile device.
Key Factors That Influence Conversions
Several factors play a major role in whether or not users convert:
- Page speed: Slow-loading pages can kill conversions.
- Trust elements: Features like security badges and customer reviews help build confidence.
- Clear Call-to-Actions (CTAs): Well-designed CTAs guide users to the next step.
- Personalized content: Tailored messaging can make a big impact.
Optimization Strategies
Improving your conversion rate takes experimentation. A/B testing, for example, can uncover what works best. Even small tweaks - like adjusting a headline or CTA - can lead to noticeable gains [7]. In e-commerce, AI-driven product recommendations have boosted conversion rates by up to 30% [14].
Tracking and Measurement
To get a full picture, monitor conversion rates at key points in the customer journey, such as landing pages, checkout processes, and lead capture forms. These touchpoints are critical for identifying where users drop off and where improvements can be made.
8. Average Order Value
Average Order Value (AOV) tracks the average amount customers spend per transaction, offering insights into spending habits. While Conversion Rate (Metric 7) focuses on how often purchases happen, AOV zeroes in on increasing the revenue from each purchase. As customers move through the buying process, boosting AOV becomes a key way to maximize income from engaged shoppers.
Industry Benchmarks
AOV varies across industries, reflecting different spending behaviors:
| Industry | Average Order Value (USD) |
|---|---|
| Luxury Goods | $428 |
| Electronics | $293 |
| Fashion | $103 |
| Food & Beverage | $72 |
Source: Statista Global Consumer Survey, 2023 [5]
Device Impact on AOV
The device customers use can influence their spending. Desktop users tend to spend more per transaction compared to mobile shoppers [7]. This trend aligns with differences seen in Conversion Rate (Metric 7), highlighting the need for cohesive strategies across metrics.
Ways to Boost AOV
Here are some effective methods to increase AOV:
-
Free Shipping Thresholds
Offering free shipping above a certain amount encourages customers to add more to their cart. Setting this threshold slightly above your current AOV can nudge shoppers to spend more [6]. -
Product Bundling
Grouping related products into packages can drive higher spending. For instance, Sephora’s seasonal Beauty Insider kits increased AOV by 19%. -
Personalized Recommendations
Suggesting products based on browsing and purchase history can significantly impact AOV. In Q2 2023, businesses using personalization tools reported higher-than-average AOV, with the global ecommerce average reaching $102.96 [11].
Factors to Keep in Mind
When tracking and optimizing AOV, consider:
- Seasonal variations (e.g., holidays or travel seasons)
- Differences between new and returning customers
- Performance across sales channels
- Combining AOV tracking with conversion metrics for deeper insights
For B2B companies, AOV is often 3-5 times higher than in B2C settings [12]. Increasing AOV also ties into reducing Cart Abandonment (Metric 9) by integrating upselling strategies.
sbb-itb-5174ba0
9. Cart Abandonment
Cart abandonment rate measures the percentage of online shoppers who place items in their cart but leave without completing the purchase. Since this happens at the final stage of the conversion process (see Customer Journey Stages), reducing cart abandonment can directly boost revenue from already-engaged shoppers.
Industry Benchmarks
Abandonment rates vary by industry, ranging from 69.57% in Retail to 83.6% in Finance [1][10]. Mobile users are the most likely to abandon their carts:
- Desktop: 73.07%
- Mobile: 85.65%
- Tablet: 80.74%
This pattern aligns with Conversion Rate trends (Metric 7), highlighting the importance of optimizing for mobile users.
Why Shoppers Abandon Carts
Knowing why shoppers leave items in their carts is key to improving the checkout experience. Common reasons include:
- Unexpected extra costs (reported by 49%) [7]
- Mandatory account creation
- Complicated checkout processes
- Concerns about security
- Lack of preferred payment options
How Businesses Can Recover
ASOS offers a great example of how strategic changes can make a difference. In 2022, they cut their cart abandonment rate from 81.45% to 74.71% in just 90 days. Here's what they did:
- Simplified checkout to a single page
- Introduced guest checkout options
- Improved the mobile shopping experience
These updates led to a 12% increase in completed purchases and an extra £3.2 million in quarterly revenue. These efforts also aligned with Cross-Channel Usage improvements (Metric 6), ensuring a smooth experience across devices.
The Role of Abandonment Emails
Abandonment emails can help recover 10-15% of lost sales when sent promptly - ideally within an hour. These emails typically see a 45% open rate and a 21% click-through rate [12].
Focus on Mobile Optimization
Since mobile users abandon carts more often, improving the mobile experience is crucial. Focus areas include:
- Streamlined, single-page checkout layouts
- Autofill features for forms
- Support for digital wallets and other mobile-friendly payment options
- Faster load times
- Clear, step-by-step guidance
10. Customer Lifetime Value
Customer Lifetime Value (CLV) helps businesses decide how much to spend on customer retention while keeping profits in check. It works as the opposite of Customer Acquisition Cost (CAC) and shows the long-term return on investment (ROI) from the customers you've already acquired.
Industry Benchmarks
CLV can differ a lot depending on the industry:
| Industry | Average CLV |
|---|---|
| SaaS | $2,280 |
| E-commerce | $1,217 |
How to Calculate CLV
The basic formula for CLV combines three main factors:
CLV = Average Purchase Value × Average Purchase Frequency × Average Customer Lifespan
For example:
A $100 purchase × 4 transactions a year × 3 years = $1,200 CLV[2][3].
This ties directly into the ideal 3:1 CLV-to-CAC ratio we mentioned earlier.
Why CLV Matters for Growth
Focusing on CLV can lead to noticeable business growth. Studies show that increasing customer retention by just 5% can boost profits by 25% to 95%[3]. Plus, customers with high CLV are responsible for 65% of referral conversions[14].
Real-Life Example
A luxury skincare brand improved its CLV by 40% using AI-powered restock reminders. This strategy cut their need for new customer acquisition by 18%[11].
Ways to Improve CLV
- Personalized Marketing: Tailor campaigns based on customer behavior.
- Engage Across Channels: Use multiple platforms to keep customers connected.
- Top-Notch Customer Service: Great support keeps customers coming back.
- Loyalty Programs: Offer rewards that align with repeat purchase habits.
Tools for Tracking CLV
The Marketing Analytics Tools Directory (https://topanalyticstools.com)[7] lists tools designed to measure customer value across all touchpoints.
11. Customer Loss Rate
This metric plays a key role in maintaining revenue over time. It's essentially the flip side of Customer Lifetime Value (Metric 10) and shows how well you're holding on to the customers you've worked hard to acquire.
Industry Benchmarks
Customer loss rates vary widely by industry:
| Industry | Annual Churn Rate |
|---|---|
| SaaS | 5-7% |
| Telecom | 10-25% |
| Retail Banking | 20-25% |
| Credit Cards | 20-22% |
How to Calculate It
The formula is straightforward:
Customer Loss Rate = (Number of Customers Lost / Total Customers at Start) × 100
For example, if you begin a quarter with 1,000 customers and lose 50, your loss rate is 5%[2][10].
A Real-Life Example
Netflix managed to lower its US/Canada customer loss rate from 3.3% to 2.5% in 2022 by offering personalized content recommendations. This effort boosted their revenue by 6%.
Warning Signs to Watch For
Look out for these red flags that may indicate a rising loss rate:
- Declining Usage: Customers are engaging less with your product or service.
- Frequent Support Tickets: A spike in complaints or technical issues.
- Payment Problems: Late or failed payments becoming more common.
- Low Satisfaction Scores: Drops in NPS (Net Promoter Score) or CSAT (Customer Satisfaction) ratings.
How to Reduce Customer Loss
Taking action early can make a big difference. Here are some effective strategies:
- Personalized Engagement: Use customer behavior and preferences to create tailored experiences.
- Proactive Support: Predict and address potential issues before they escalate. Predictive analytics can help identify customers at risk[15].
- Showcase Value: Regularly highlight your product's benefits and introduce new features to keep customers engaged.
12. Repeat Purchase Rate
The Repeat Purchase Rate tracks how many customers come back to make additional purchases. It's a key metric for understanding customer retention and plays a direct role in boosting long-term revenue and loyalty[1][3].
Industry Benchmarks
The target repeat purchase rate varies by industry:
| Industry | Typical Rate |
|---|---|
| E-commerce | 20-40% |
| Subscription Services | 60-80% |
| B2B Software | 80-90% |
| Retail (Brick-and-Mortar) | 20-40% |
| Luxury Goods | 15-25% |
How to Calculate It
You can calculate your repeat purchase rate using this formula:
Repeat Purchase Rate = (Repeat Customers / Total Customers) × 100
For example, if you have 1,000 customers and 300 of them make multiple purchases, your repeat purchase rate is 30%[2].
Real-World Example
Starbucks' rewards program is a great example of how to drive repeat purchases. Members of the program have an 80% higher repeat purchase rate compared to non-members, contributing to over half of the company's U.S. store sales[5].
Factors That Influence Repeat Purchases
What makes customers return? Several things:
- Product Quality: Delivering what customers expect - or better.
- Customer Service: Quick and effective support when needed.
- Shopping Experience: Easy checkout and reliable delivery.
- Post-Purchase Engagement: Follow-ups and tailored suggestions.
- Perceived Value: Competitive pricing and clear benefits.
Tips to Boost Your Rate
Want to increase your repeat purchase rate? Here’s how:
- Build loyalty programs and send personalized emails based on past purchases.
- Offer perks like exclusive discounts and make reordering hassle-free.
This metric naturally connects to advocacy-focused measurements like the Net Promoter Score (Metric 13).
13. Net Promoter Score
Net Promoter Score (NPS) is a key metric used to measure customer loyalty and their likelihood of recommending your business. As customers move into the advocacy stage, NPS becomes an important tool for predicting growth driven by word-of-mouth.
How NPS Works
NPS is based on a simple question: "How likely are you to recommend our company/product/service to a friend or colleague?" Respondents answer on a scale from 0 to 10, and their responses are grouped into three categories:
| Category | Score Range | Description |
|---|---|---|
| Promoters | 9-10 | Loyal customers who are likely to recommend you |
| Passives | 7-8 | Satisfied but not enthusiastic; may switch to competitors |
| Detractors | 0-6 | Unhappy customers who could harm your reputation |
To calculate NPS, subtract the percentage of Detractors from the percentage of Promoters. For instance, if 60% of respondents are Promoters and 10% are Detractors, your NPS would be +50.
Industry Performance
NPS benchmarks vary by industry. For example, utilities tend to average around +15, while the tech sector sees averages closer to +55. A standout example is Apple's iPhone, which boasts an NPS of +68, according to Retently NPS Benchmarks (2022)[9].
Strategic Implementation
Here are some best practices for using NPS effectively:
- Timing Matters: Collect feedback at key moments, such as after a purchase or service interaction[2][4].
- Ask for Details: Include a follow-up question like, "What’s the main reason for your score?" to gather actionable insights.
- Quick Responses: Address Detractor feedback within 24 hours to show customers you care[6].
- Segment Results: Break down scores by customer type, product, or stage in the customer journey for deeper insights[3].
This metric ties directly to Referral Success Rate (covered in Metric 14), which measures how well recommendations translate into new business.
Integration with Analytics
Modern analytics tools can link NPS to other metrics, like Customer Lifetime Value (CLV)[2][4]. These platforms allow for real-time tracking and analysis across multiple channels. For a comprehensive list of tools, check out the Marketing Analytics Tools Directory (https://topanalyticstools.com)[8].
Using NPS insights to improve operations can strengthen customer loyalty and set the stage for analyzing Referral Success Rate, which measures the impact of recommendations on acquiring new customers.
14. Referral Success Rate
Referral Success Rate ties closely to NPS (Metric 13), highlighting how customer recommendations lead to conversions.
Referral Success Rate = (Number of Referred Customers ÷ Total Referred Leads) × 100
Across industries, the average referral conversion rate is 2.35%[9]. However, a strong benchmark typically ranges between 25-30%[16].
Why Referred Customers Matter
Customers gained through referrals often perform better than those from other channels. Here's how they stack up:
| Metric | Referred Customers' Advantage |
|---|---|
| Retention Rate | 37% higher retention compared to other channels[11] |
| Close Time | 69% faster for B2B companies[7] |
| Customer Lifetime Value | 59% greater value for B2B companies[7] |
Real-World Example: Dropbox's Referral Program
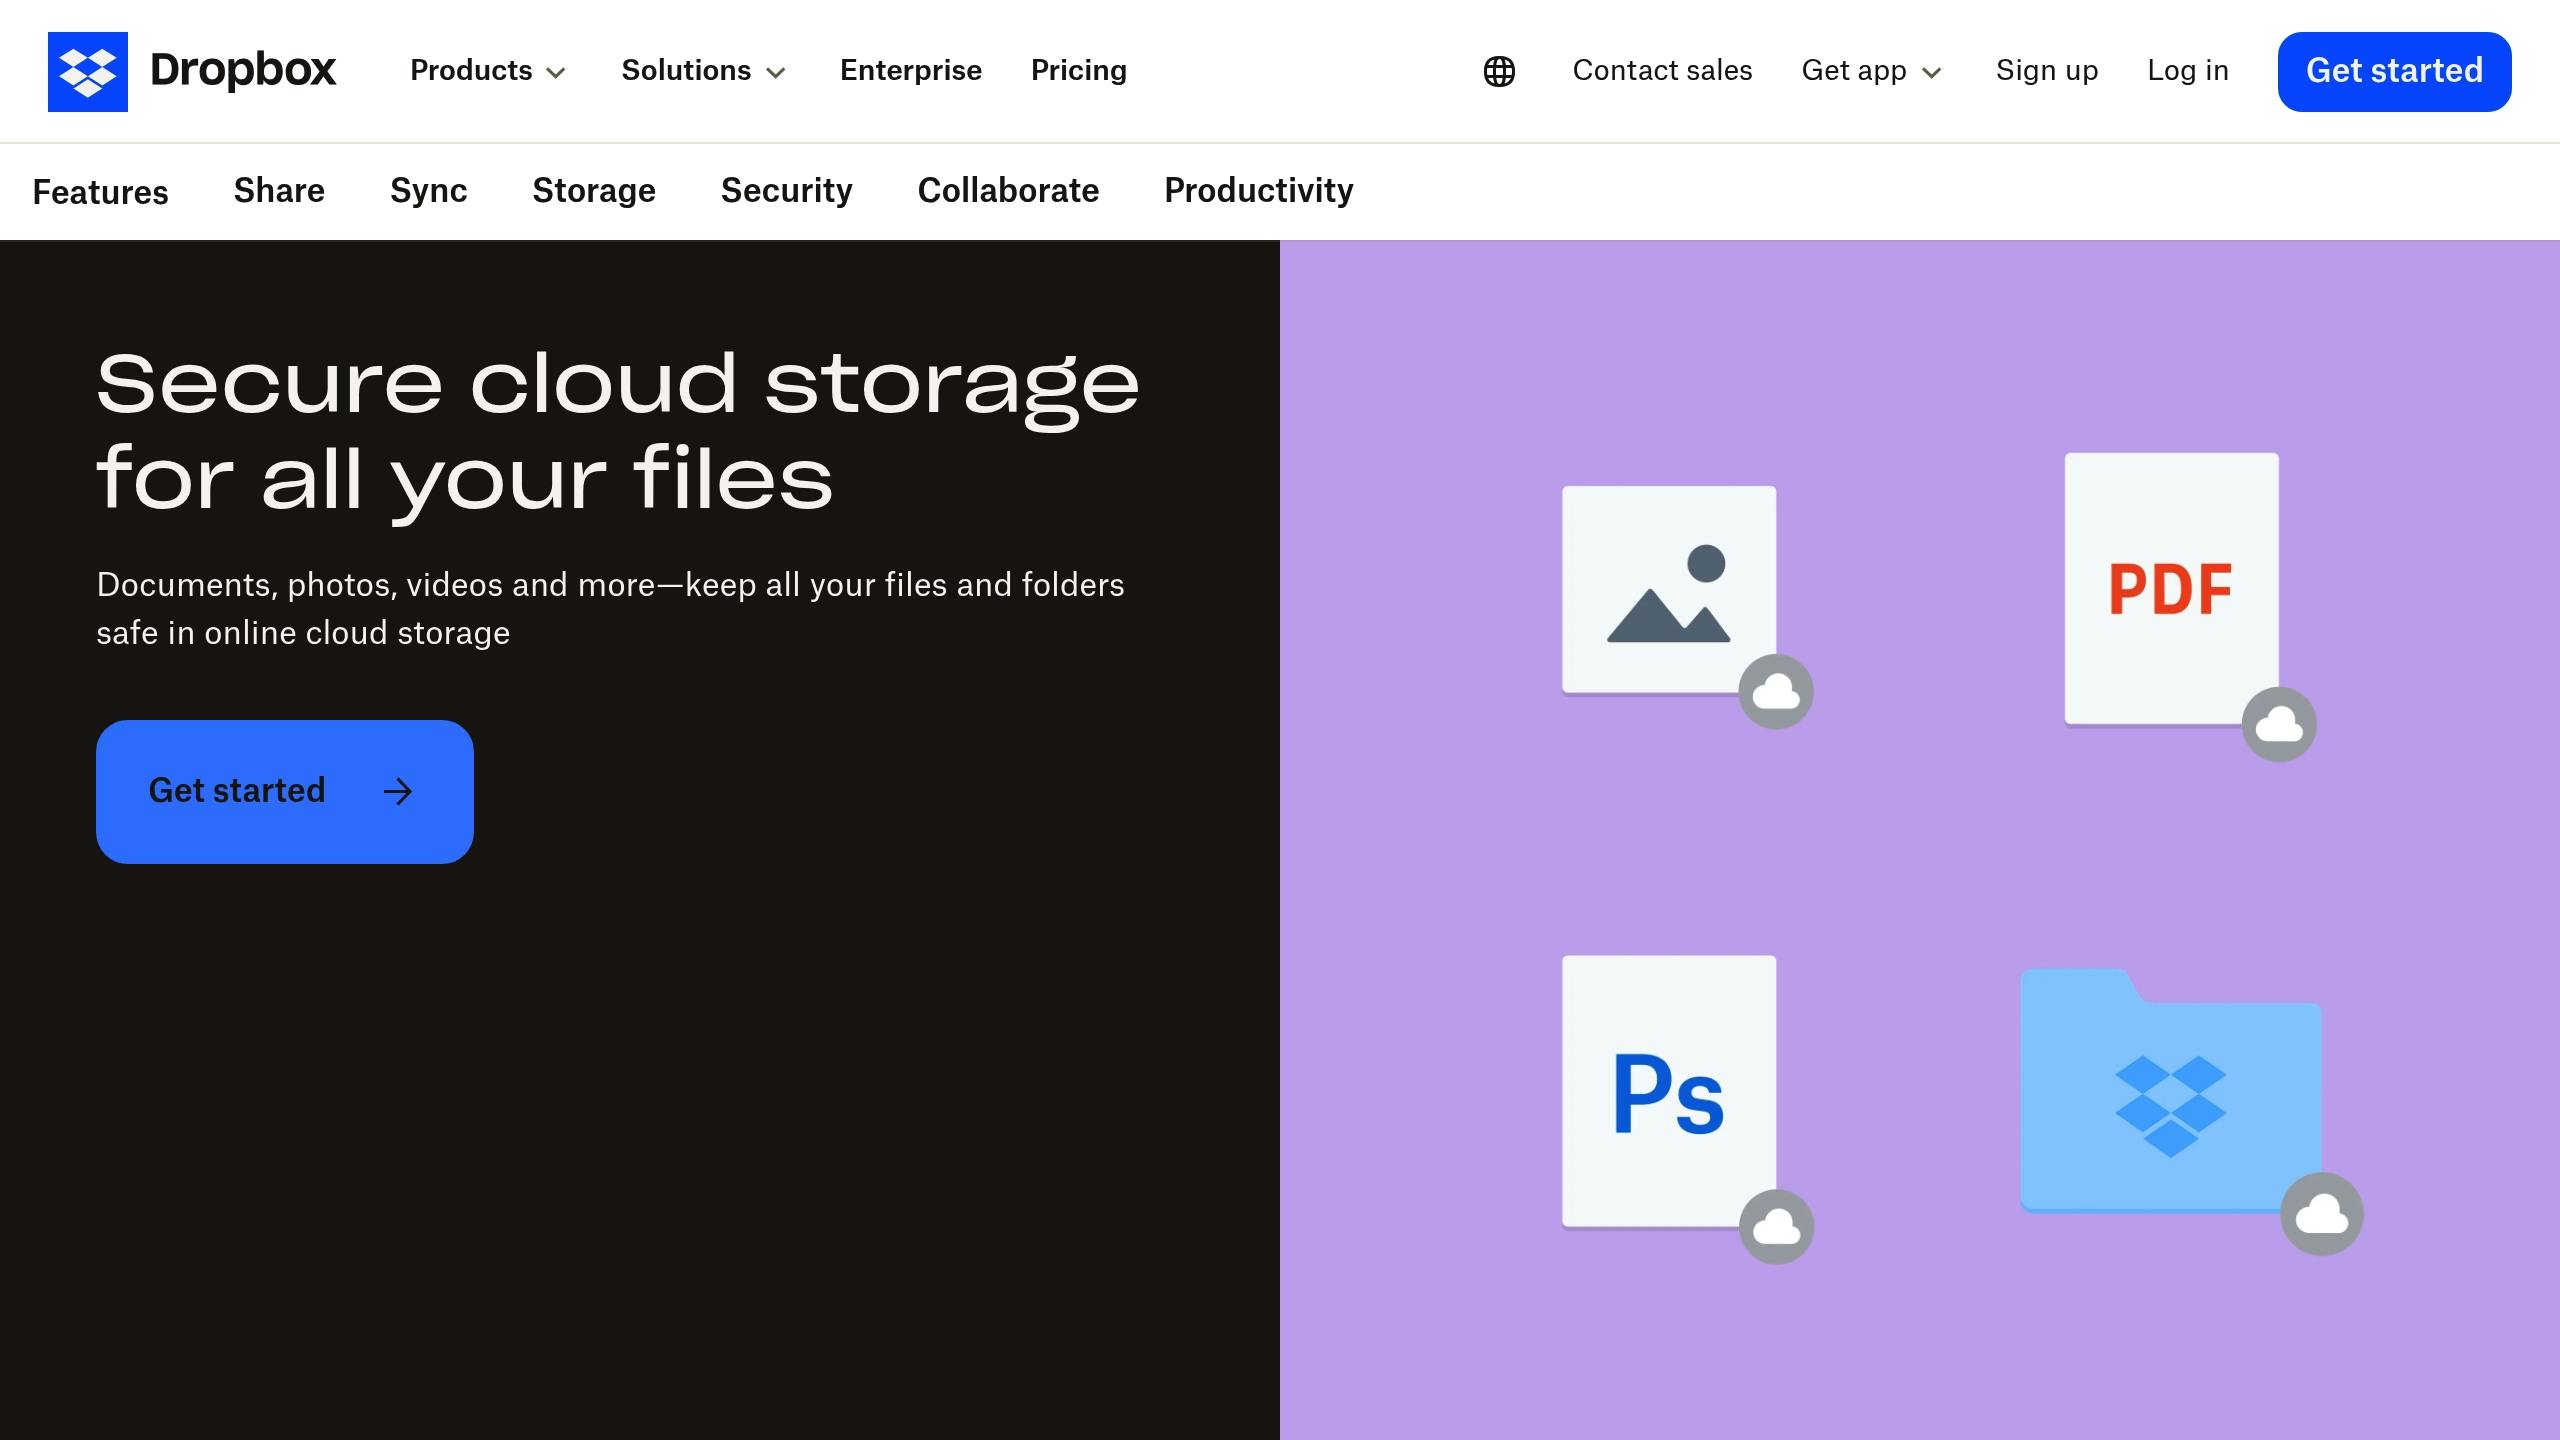
Dropbox boosted signups by 60% through its referral program, offering incentives for both referrers and new users. Referred users were also 35% more likely to upgrade than others.
How to Boost Your Referral Success Rate
Here are three ways to improve your referral program:
- Reward Both Sides: Offer benefits to both the referrer and the new customer.
- Keep It Simple: Make the referral process straightforward and easy to complete.
- Monitor Performance: Use referral tracking tools to analyze and optimize your efforts.
If you're looking for tools to track referrals, the Marketing Analytics Tools Directory (https://topanalyticstools.com) provides a detailed comparison of platforms.
This metric naturally connects to Social Share Rate (Metric 15), which measures how customers promote your brand on social media.
15. Social Share Rate
Social share rate measures how often your content gets shared across social media platforms. As a key advocacy-stage metric, it complements Referral Success Rate (Metric 14) by tracking organic promotion of your brand. For most businesses, a solid benchmark is around 2-3%, though viral content can sometimes surpass 10%.
Share Rates by Platform
Different platforms perform better with specific types of content. Here’s a quick breakdown:
| Platform | Best-Suited Content Types |
|---|---|
| Professional or industry-focused | |
| Visual and lifestyle content | |
| News and trending topics | |
| Video content |
Why It Matters
Higher social share rates can lead to some impressive outcomes:
- Posts with images generate 40x more engagement than text-only posts [9].
- Shared content boosts customer acquisition efforts (Metric 2) while reinforcing your retention strategies (Metric 12).
Real-Life Example: Airbnb's #LiveAnywhere Campaign
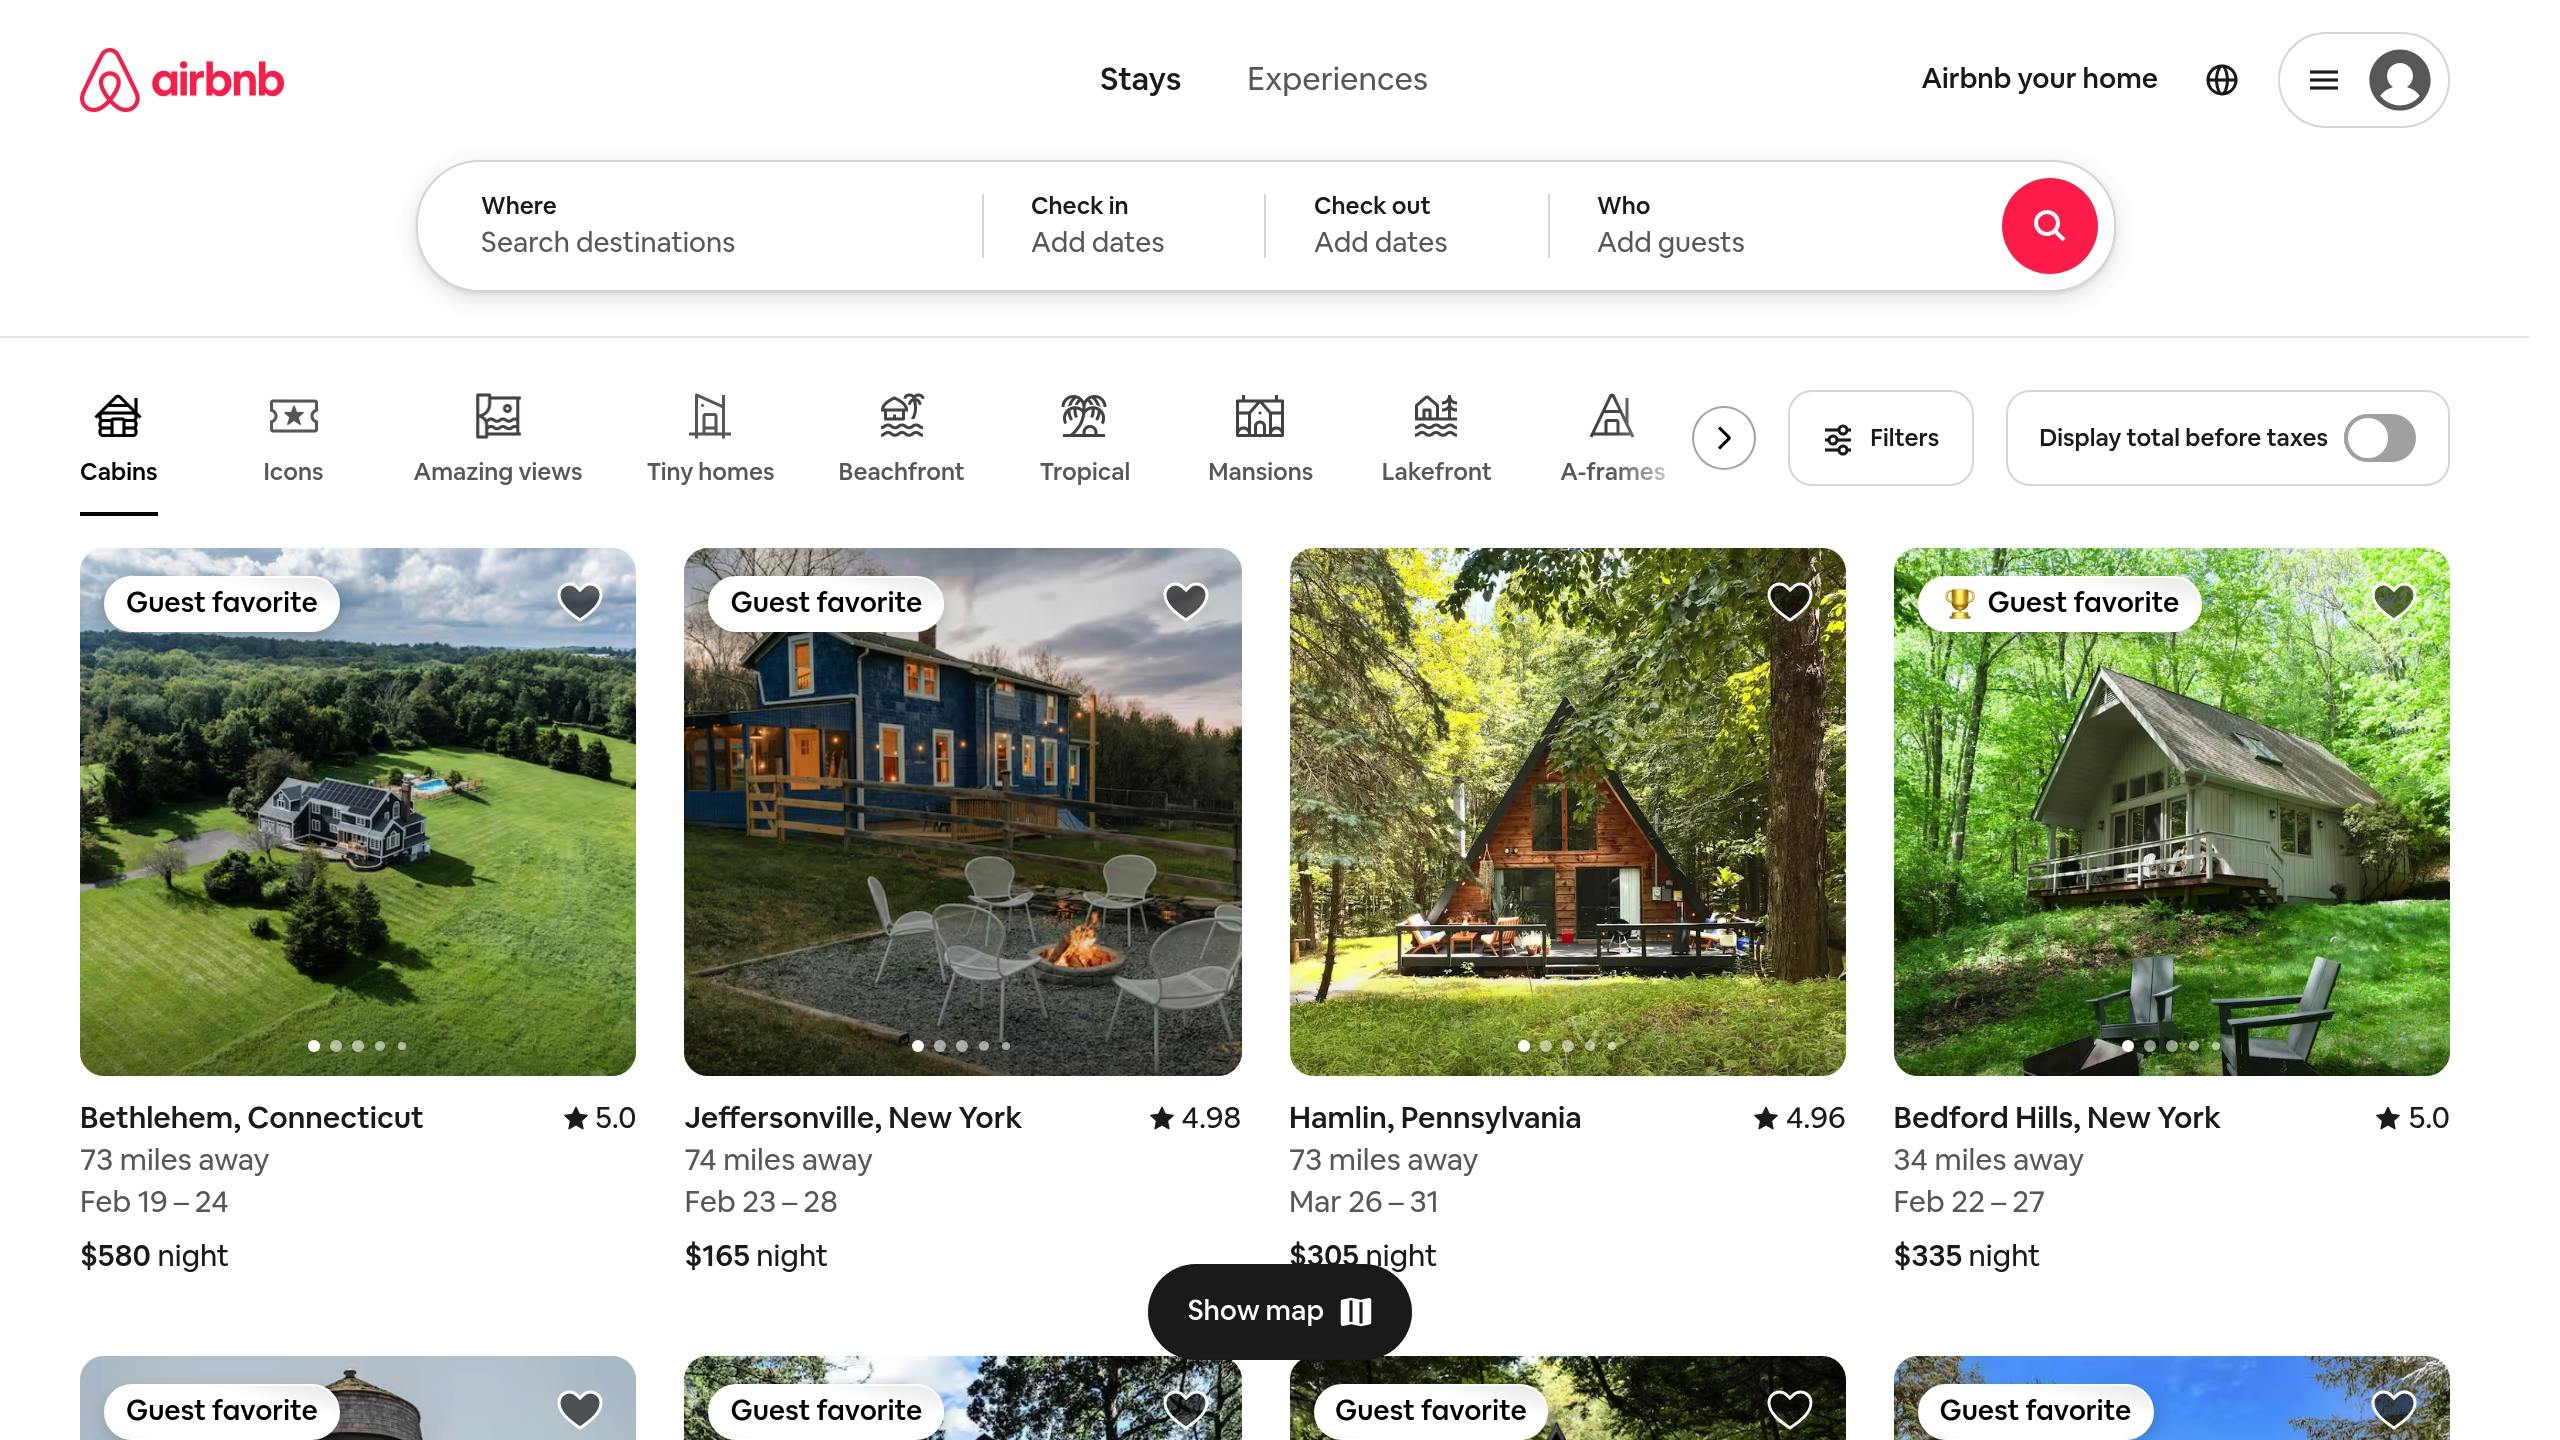
In 2022, Airbnb launched the #LiveAnywhere campaign, which increased social shares by 61%. This surge in user-generated content helped drive 22% more new customer bookings.
Tips to Boost Social Share Rate
Here are some ways to improve your social share rate:
- Focus on Mobile-Friendly Content: Ensure your content is optimized for mobile.
- Use Visual Storytelling: Eye-catching visuals resonate more with audiences.
- Tap Into Emotions: Craft messages that align with your audience’s values and feelings.
Strong social share rates help close the loop on the customer journey by turning happy customers into vocal advocates for your brand.
Tracking Tools
To effectively monitor the customer journey, you need the right analytics tools. The analytics market is projected to grow from $8.3 billion in 2022 to $25.1 billion by 2028[9]. These tools allow you to measure the 15 customer journey metrics mentioned earlier with precision.
Enterprise Solutions
For large organizations, certain platforms are particularly well-suited for advanced analytics:
| Platform | Key Features | Best For |
|---|---|---|
| Adobe Analytics | Real-time analysis, advanced segmentation | Large enterprises |
| Salesforce Journey Builder | CRM integration, email journey tracking | Mid to large-sized companies |
| Contentsquare | Behavioral insights, digital experience mapping | UX-focused teams |
An example of success: Sephora's integration of Salesforce Marketing Cloud in 2022 led to a 70% boost in email open rates and a 15% increase in conversion rates, resulting in $50 million in additional annual revenue[11].
For smaller businesses, there are cost-effective options that still deliver strong tracking capabilities.
Small Business Options
- Google Analytics 4: Offers cross-platform tracking, machine learning insights, basic attribution, and custom event tracking.
- Mixpanel and Amplitude: Great for product analytics, both platforms provide affordable entry points for growing businesses.
Integrating these tools with existing systems is crucial for maximizing their effectiveness.
Integration Considerations
Attribution tools are widely used, with 67% of marketing leaders relying on them[3]. Seamless integration is key, and resources like the Marketing Analytics Tools Directory can help you compare features and pricing across platforms.
Data Privacy Compliance
Modern analytics tools must strike a balance between tracking and privacy. Look for tools that include:
- Compliance with GDPR and CCPA
- First-party data collection
- Consent management systems
- Options for data anonymization
Maintaining this balance is essential for effective, ethical, and data-driven customer journey tracking.
Conclusion
Tracking these metrics can lead to tangible business improvements, such as reducing service costs by 15–20% and increasing cross-selling and upselling by 10–15% [3]. For instance, in 2022, a telecommunications company focused on their "Restore Connectivity" journey. This effort resulted in 25% more successful self-service resolutions and a 15% drop in support calls [3].
These metrics serve three key purposes:
- Performance Measurement: They tie customer behavior directly to outcomes like revenue and customer lifetime value (CLV), helping quantify the impact of customer experiences.
- Strategic Decision Making: By combining leading and lagging indicators, businesses get a clear view of journey performance, enabling proactive improvements [13].
- Continuous Optimization: Monitoring journey scores helps quickly identify and address areas that aren't performing as expected [3].
To implement these metrics effectively:
- Start by focusing on the most critical customer journeys before expanding.
- Adjust KPIs based on actionable insights gathered over time.
- Maintain a balance between metrics that reflect customer satisfaction and those that measure business outcomes.
- Use the right analytics tools to gather and interpret data.
When applied thoughtfully, these metrics can elevate every stage of the customer journey. Paired with strong analytics tools and a data-driven mindset, they lay the foundation for better customer experiences and sustained growth.
As one expert explained:
"Journey-centric organizations typically group customer journeys into six or seven high-priority areas, allowing for focused optimization efforts" [3].
This structured strategy ensures continuous improvements and supports long-term business success.
FAQs
How to measure a customer journey?
To measure the customer journey effectively, focus on key metrics for each stage. Here's a breakdown:
| Journey Stage | Key Metrics | Purpose |
|---|---|---|
| Awareness | Impressions, reach, time on page | Understand how customers discover your brand |
| Consideration | Clicks, CTR, engagement rate | Gauge interest and research behavior |
| Decision | Conversion rate, sales | Track purchase decisions |
| Retention | Customer loyalty, NPS | Measure satisfaction over time |
| Advocacy | Referrals, social shares | Monitor brand promotion efforts |
A case study from Medallia in August 2024 showed that combining behavioral insights with traditional metrics improved digital retention by 15% [7].
For a comprehensive view of the customer journey, combine quantitative data (metrics like sales and engagement rates) with qualitative insights (feedback and surveys). Here are some practical steps to get started:
- Identify core KPIs for critical touchpoints.
- Use tools that integrate data across multiple channels.
- Review metrics quarterly and adjust your approach as needed.
- Balance forward-looking (leading) and historical (lagging) indicators [13].
Measuring the journey connects customer behavior to outcomes like revenue and profitability [3]. For example, you can calculate the Customer Satisfaction Score (CSAT) by adding the number of "4" and "5" ratings, dividing by total responses, and multiplying by 100 [14].
If you're new to journey measurement, check out resources like the Marketing Analytics Tools Directory to find tools suited to your business size and needs. These steps can help you refine your strategy and enhance the overall customer experience.